Session High Low
This indicator shows Session High Low line and prices.
1: Session range is adjustable based on your timeframe. Nomore confusing timezone settings.
You can choose your timezone then set your Session start and end time.
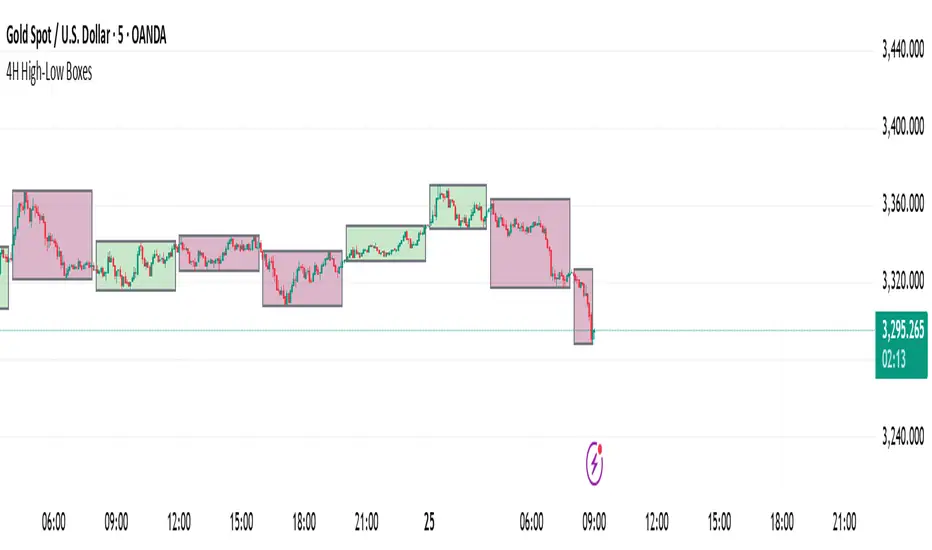
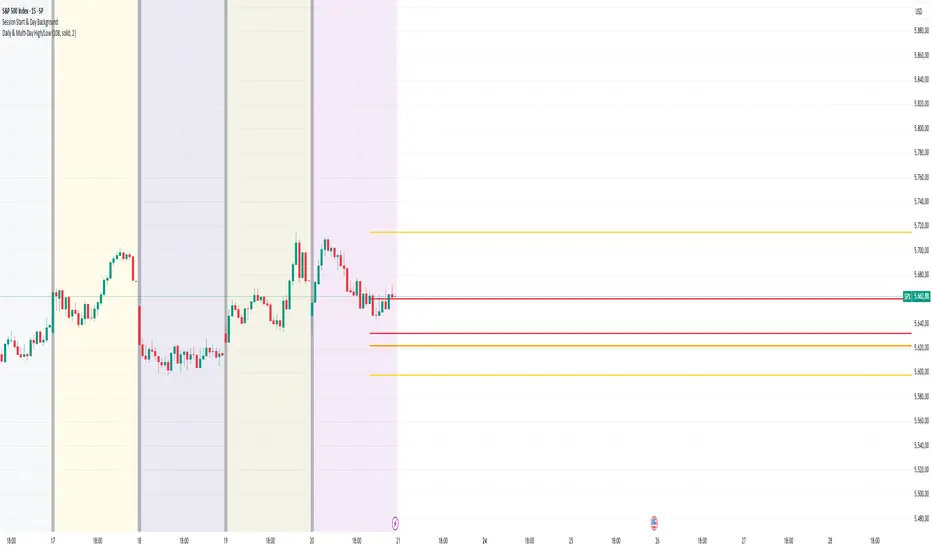
Script will show you the following session high and low lines which is extendable until next session.
2: All historical lines and price levels are can be partially or fully hidden.
And line colors are adjustable so you can use suitable color on your chart.
Based on session you choose this script can be used as a session break strategy AKA (Asian session break, London session break strategy).
You can create your own trading Session and high lows.
Personally I monitor how price reacts on London session high lows during the NewYork trading session.
In this chart Session starts at 8am (London open) and closes at 12:30 (NewYork open). Script is showing high lows only in this session range.
Always double confirm with your trading style. It's not a Financial advice.
Inputs:
1: Hide history - Hides all historical lines and prices that means you can see only todays session.
2: Show price - Shows price level of session high lows. You can hide price level if you want to see only lines.
3: Session time - You can set your time range of session.
4: Start time - Session start time. You can see vertical line on your chart or you can hide line.
5: End time - Session end time. You can see vertical line on your chart or you can hide line.
6: Line extend time - End of the high low lines. You can draw line until the end of the session or you can draw short line.
7: All line and price colors are optional.
Thank you.
Penunjuk Pine Script®